Adding metrics to Lightdash
Metrics are used to perform calculations on your Tables.
If you're completely new to Lightdash, we'd recommend checking out our Tutorial on creating your first dimensions in Lightdash first to learn a bit more about how to develop in Lightdash.
👩💻 Adding metrics in your dbt .yml files
Metrics in your Lightdash project are defined in your dbt project .yml files along with your dimensions and dbt model properties. You add them to your project the exact same way as you add dimensions to your project (<- if you haven't checked out that guide yet, we'd recommend starting there first).
If dimensions segment your data into groups, metrics calculate interesting statistics for those groups.
For example, if we have a dimension, status, to split orders by their status, we may want to know the "Total number of orders" or the "Total sales" of the orders. These calculations are metrics:
# schema.yml
version: 2
models:
  - name: "orders"
    description: "A table of all orders."
    columns:
      - name: "status"
        description: "Status of an order: ordered/processed/complete"
      - name: "order_id"
        meta:
          metrics:
            total_order_count:
              type: count_distinct
      - name: "order_value"
        meta:
          metrics:
            total_sales:
              type: sum
You can see the full list of metric types that you can use in your Lightdash project.
We support metrics defined using either Lightdash or dbt syntax! You can read more about the two methods in our reference docs here.
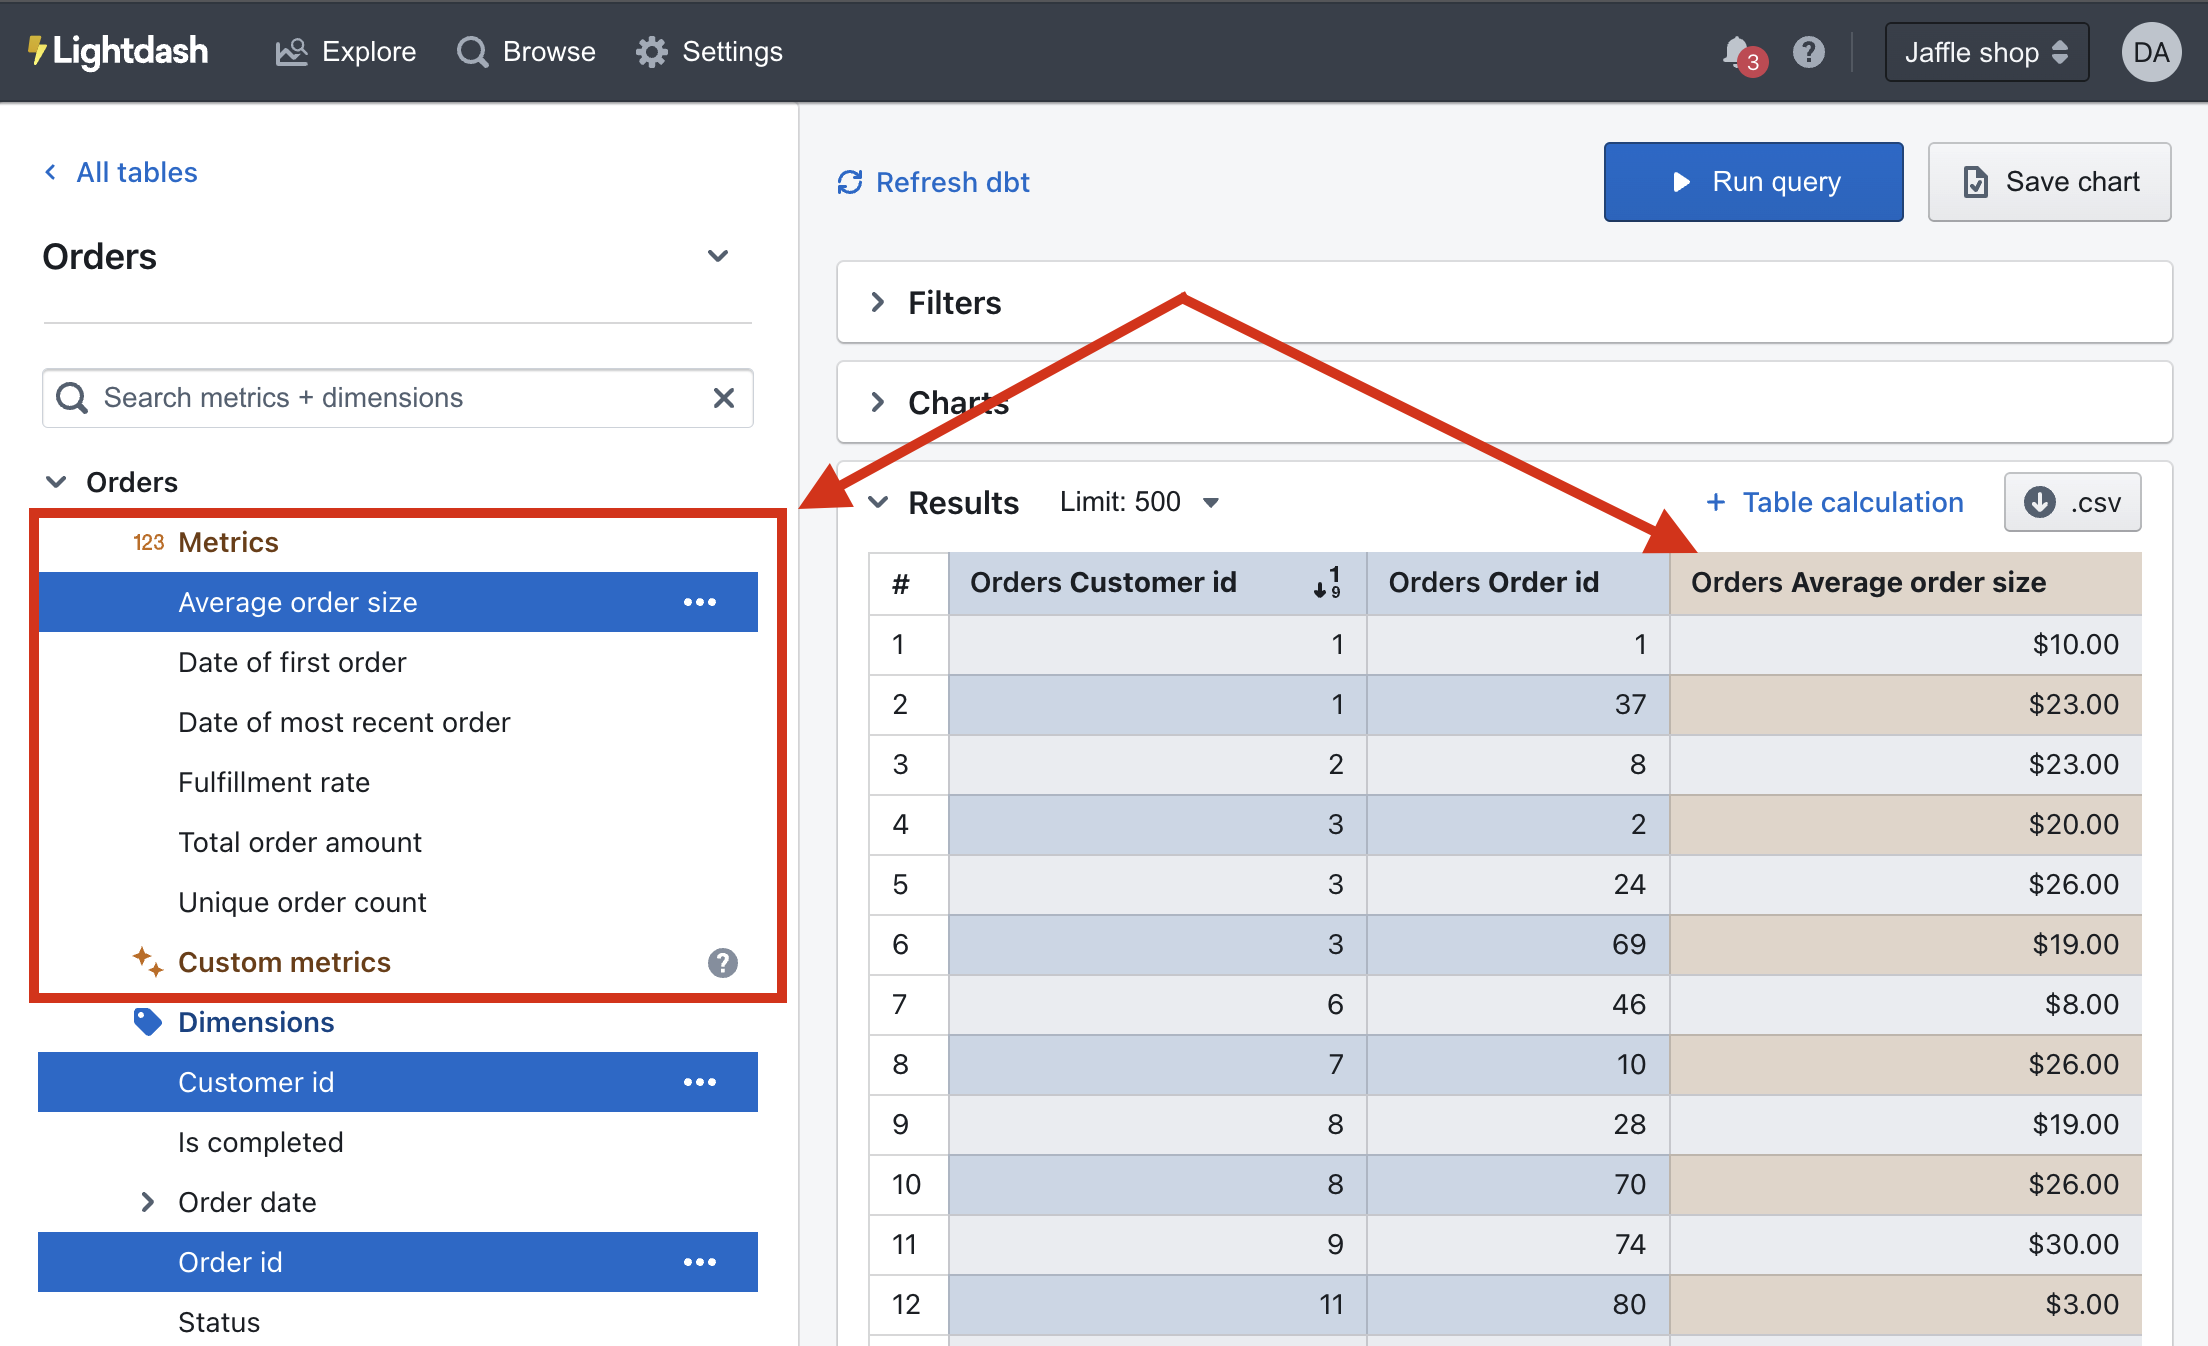
Once you've added your metrics, you can use them in Lightdash to build charts and filter results. Metrics appear in the Explore view, above dimensions and, if selected, pop us as brownish-yellow fields in your results table.
🧑🏭 Let's try adding a metric to our dbt project
info
Before you get started with the next steps, you might want to check out onto a new branch if you're working with a version controlled project!
We're going to try adding a new metric to our dbt project, then syncing it with Lightdash. We've made this really easy to do using our CLI tool. This tutorial assumes that you've installed + logged into the Lightdash CLI tool.
Add a metric to one of your dbt models
Head to your dbt project and add a metric to one of your dbt models.
We'd suggest starting out simple, like a count for a primary key in your table.
For example:
# schema.yml
version: 2
models:
  - name: "orders"
    columns:
      - name: "status"
      - name: "order_id"
        meta:
          metrics:
            total_order_count:
              type: count
Preview your changes using lightdash preview
Once you've added a metric to your dbt model, you might want to check to make sure that it's working the way you'd expect. This is where lightdash preview comes in handy.
Developer previews are temporary Lightdash projects where you can safely experiment with your metrics, dimensions and charts without affecting your production project.
So, let's spin up a developer preview and check out our changes. In your terminal, run the commands:
lightdash preview
Then cmd + click to open the preview link from your terminal. Once you're in Lightdash go to Explore --> Tables, then click on the model you just updated to see your new metric and play around with it.
If you're happy with your new metric, you can deploy it to production.
Once you're happy with your changes, you'll want to commit them and push/merge them to the branch connected with Lightdash (e.g. main or master).
Once those changes are merged into your dbt project, you can either run lightdash deploy on your command line or hit "Refresh dbt" in the Lightdash UI to start exploring your new metric in production!
🎛 Configuring the metrics in your .yml files
You can jazz up your metrics by configuring them in your .yml files. These metric configurations live under the meta tag of your columns:
version: 2
models:
  - name: "orders"
    description: "A table of all orders."
    columns:
      - name: "status"
        description: "Status of an order: ordered/processed/complete"
      - name: "order_value"
        meta:
          metrics:
            total_sales:
              type: sum
              label: "Total sales (USD)"
              round: 2
              ...etc.
Things like the format, the label that people see in Lightdash, rounding, etc. - these are all configurations that you can apply to your metrics.
You can see all of the metric configurations in our metrics docs here.
🪄 Adding custom metrics in the Explore view
The fields that you see in your dimensions and metrics are created by the people maintaining your Lightdash project.
But, if there's something missing from this list of metrics, you can use custom metrics to add some on-the-fly calculations while you're exploring.
So, we're going to break it down for you: what are custom metrics? and how can I use them? 🪄
🥸 Custom metrics are different from the metrics defined in your YAML
Like we mentioned above, custom metrics are on-the-fly calculations in the Explore view. They're a bit different to the regular metrics you define in your Table's YAML, but some things are the same.
Here are some things about custom metrics we thought would be worth mentioning:
- It's harder to manage custom metrics in your project than regular metrics. We recommend adding the metrics that everyone is going to use regularly to your dbt project. This is because custom metrics are missing out on things like formatting, custom descriptions, and any other configuration options that you have available to you for metrics defined in your dbt project. So, for metrics that are going to have a lot of use, we recommend taking the next step in your data "relationships" and making them a bit more permanent 😉
- You can't persist your custom metrics in the Table. If you add some custom metrics in the Explore view, then these custom metrics won't pop up for the next person that opens the Table.
- But, you can use custom metrics in a saved chart. If you've added custom metrics to your saved chart, and someone else opens the saved chart, they'll see your custom metrics. But, if they open a new, fresh Table in the Explore view, your custom metrics won't appear there.
- You can't use custom SQL in your custom metrics. If you need to write some more complicated SQL to define your metric, then you'll need to define it as a metric in your dbt project.
💡 Creating a custom metrics from a dimension
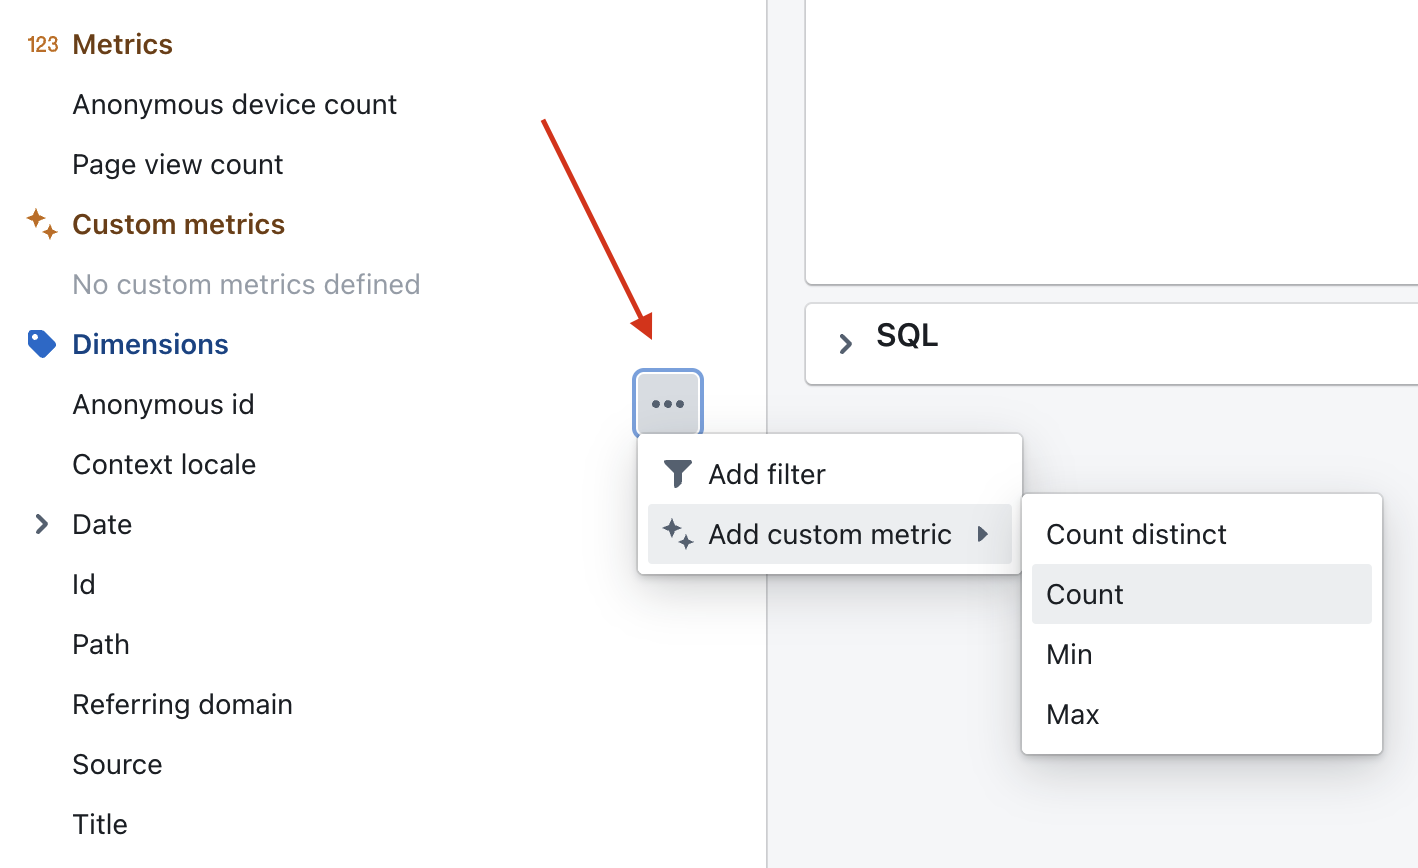
To create a custom metric from a dimension, you just need to:
- Click on the dimension's three-dot
optionsmenu - Click on
Add custom metric - Click on the metric you'd like to add
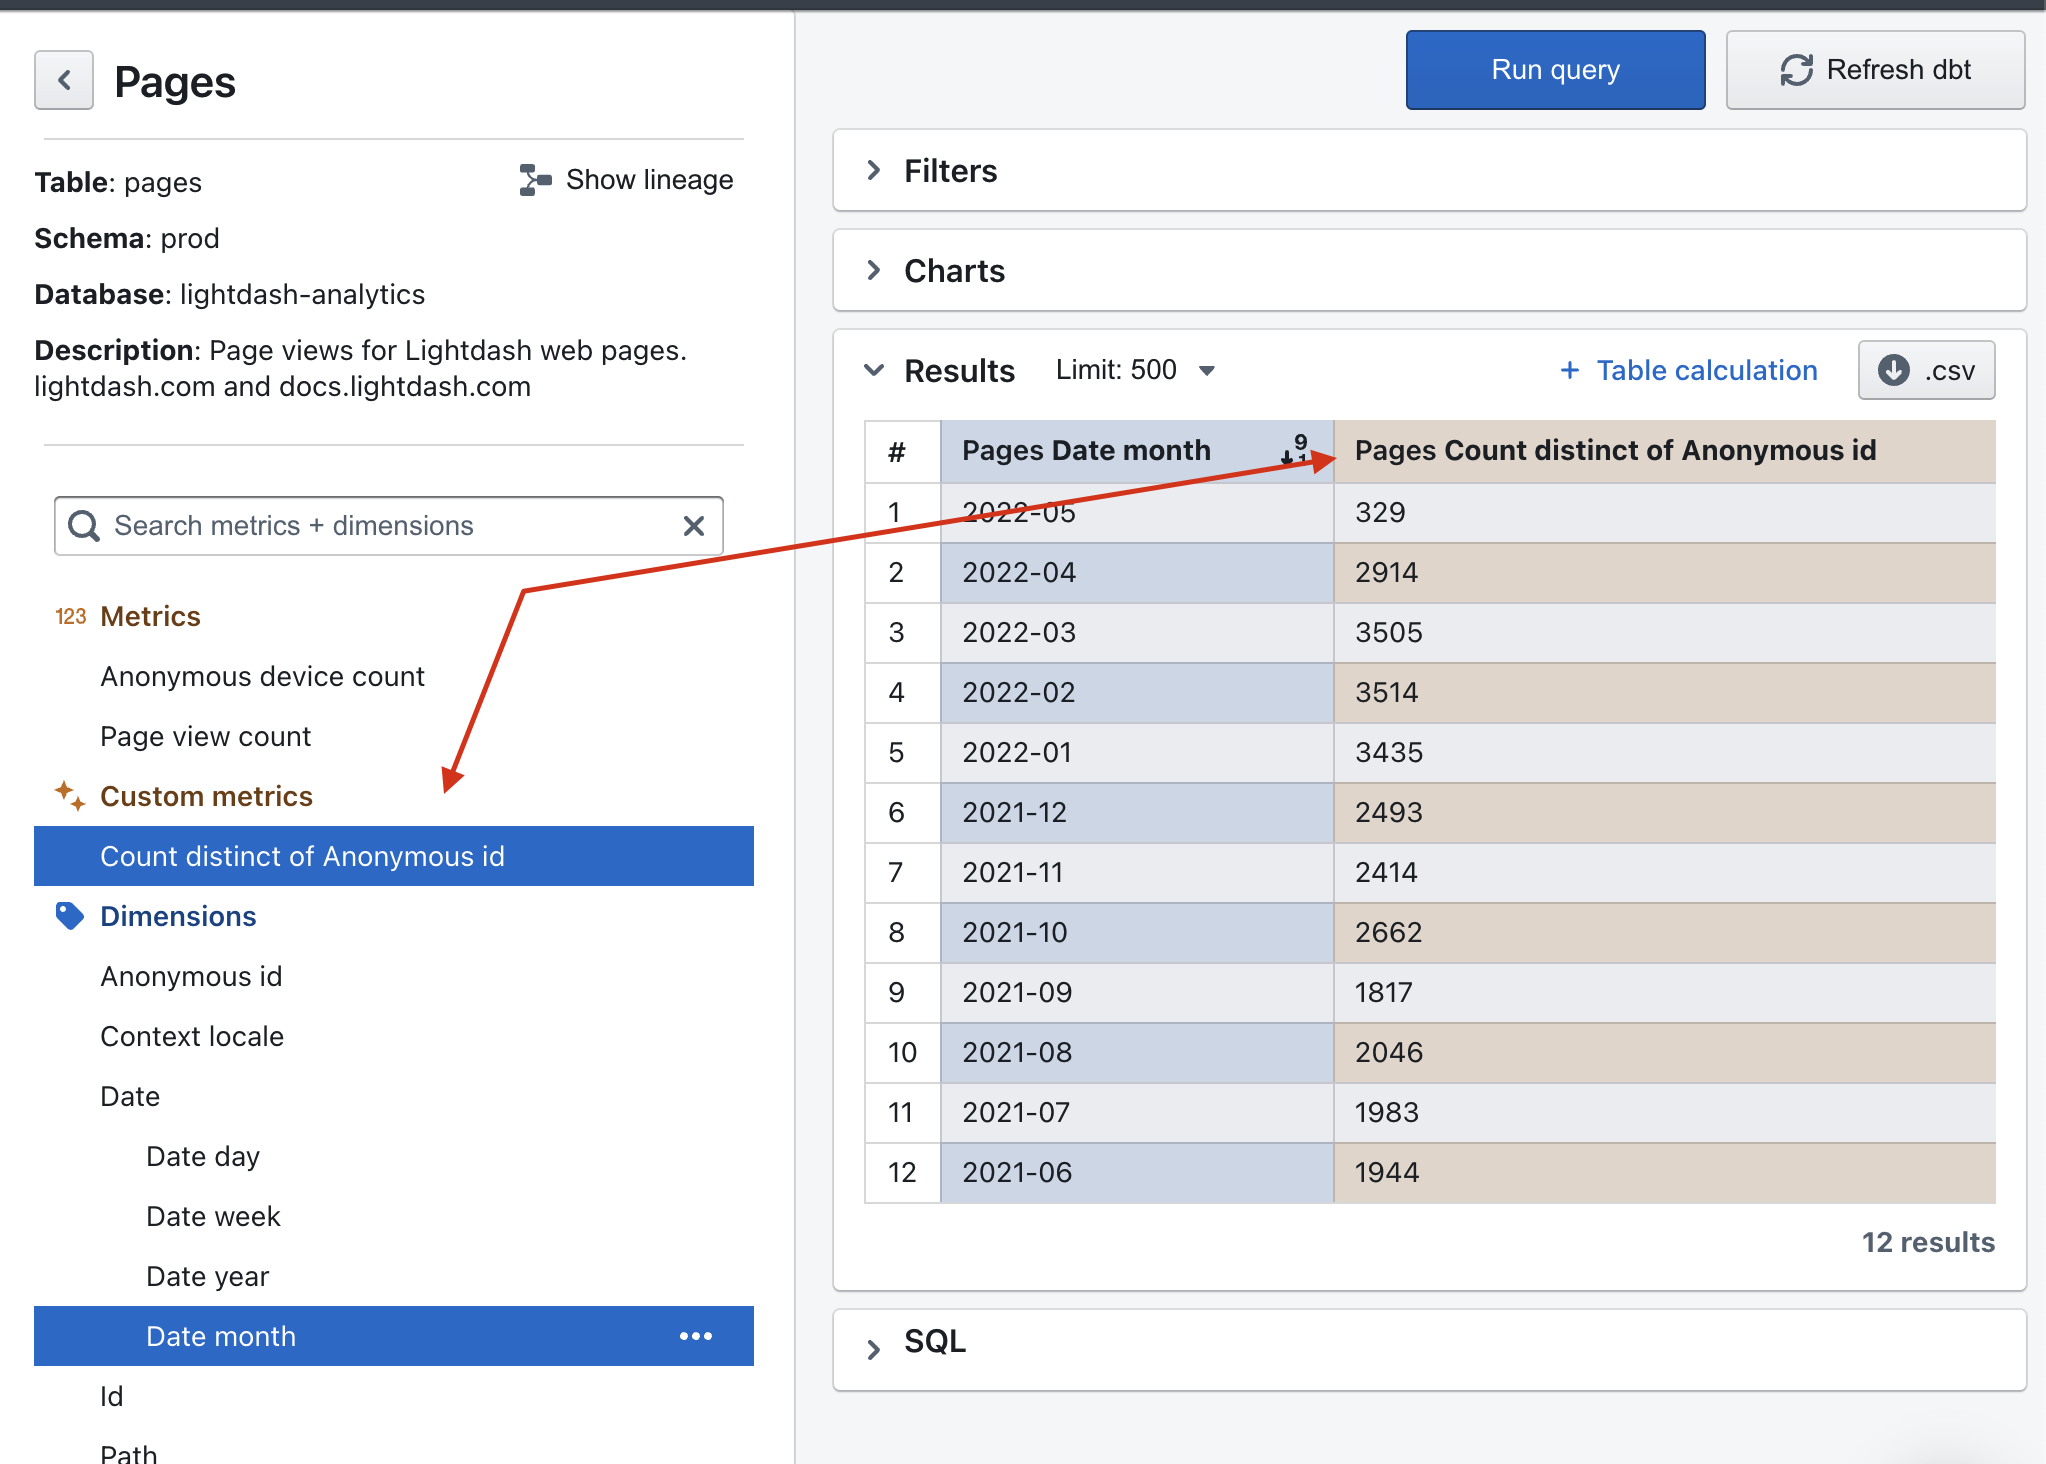
Then, your new metric will be added to your results table automatically and will appear in the custom metrics space in your sidebar.
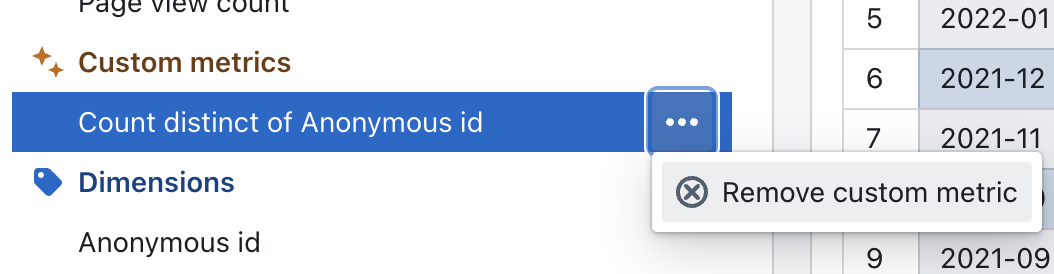
If you want to delete the custom metric, you can just click on the three-dot options menu and hit Remove custom metric
Now, go forth and aggregate!