Create your first metrics
What is a metric?
Metrics are defined in your dbt project alongside your dbt model properties.
- Dimensions are used to segment data in your Tables.
- Metrics are used to perform calculations on your Tables.
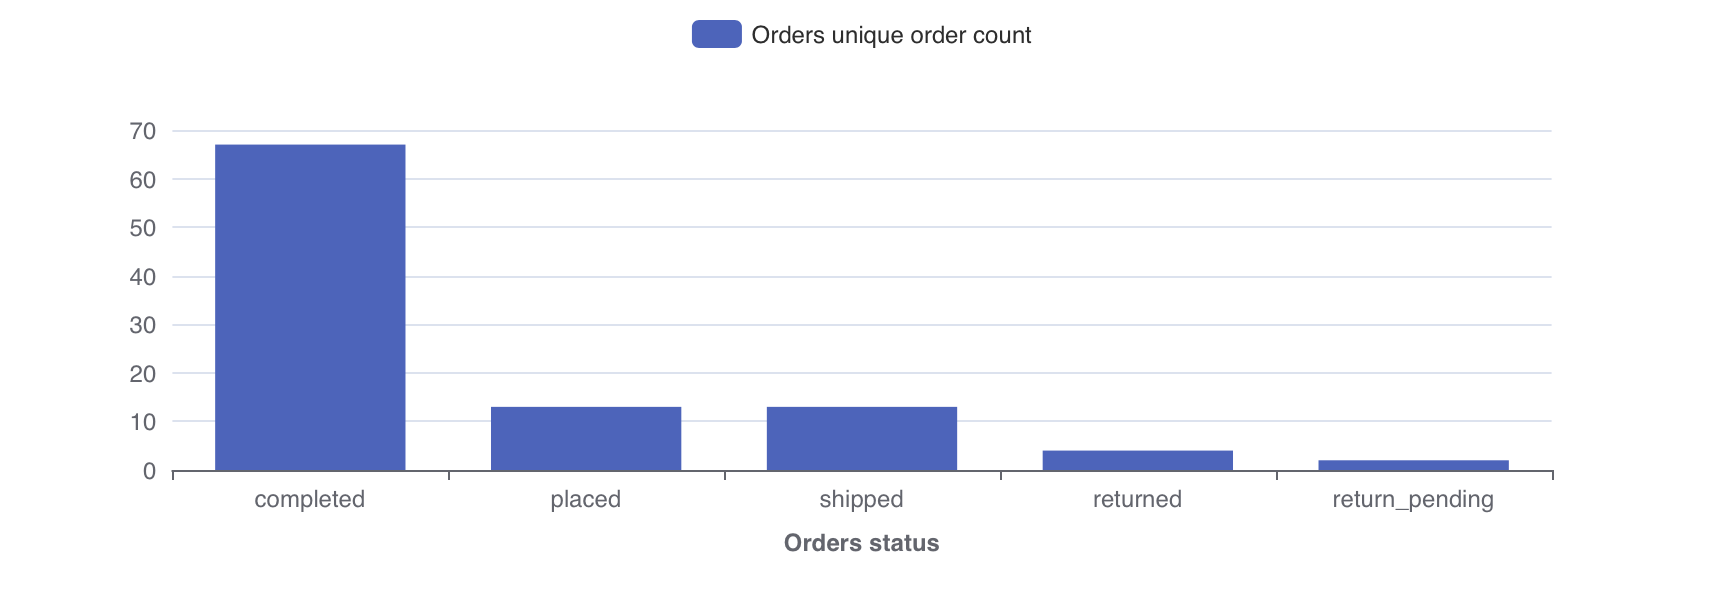
Say we're running an ecommerce business, we probably have a table containing all order data. We might want to ask:
This question can be answered using a single metric "the total number of unique orders" and a single dimension for splitting the metric by "status of order". In Lightdash you'd get the following chart:
To learn more about why we use dimensions and metrics in Lightdash, read the Lightdash approach to BI.
How to build metrics in Lightdash
Here's a quick video showing how we develop metrics in our Lightdash projects. We'll cover these steps in more details below!
1. Add a metric to your project
Metrics are defined in your dbt project files along with your dimensions and dbt model properties.
If dimensions segment your data into groups, metrics calculate interesting statistics for those groups.
For example, once we've used the status dimension to split orders by their status, we may want to know the
"Total number of orders" or the "Total sales" of the orders. These calculations are metrics:
# schema.yml
version: 2
models:
  - name: "orders"
    columns:
      - name: "status"
      - name: "order_id"
        meta:
          metrics:
            total_order_count:
              type: count
You can see the full list of metric types that you can use in your Lightdash project.
Go ahead and try adding a metric to a model in your project.
We'd suggest starting out simple, like a count for a primary key in your table.
For example:
# schema.yml
version: 2
models:
  - name: "orders"
    columns:
      - name: "status"
      - name: "order_id"
        meta:
          metrics:
            total_order_count:
              type: count
2. Login to the Lightdash CLI
Once you've added a metric to your dbt model, you might want to check to make sure that it's working the way you'd expect. This is where lightdash preview comes in handy.
Developer previews are temporary Lightdash projects where you can safely experiment with your metrics, dimensions and charts without affecting your production project.
To build a preview, you'll need to authenticate yourself in the Lightdash CLI.
(Note that if you are using Google SSO login you should authenticate via environment variables.)
1. Run the Login command to use your email and password.
lightdash login https://my-lightdash.domain.com
where https://my-lightdash.domain.com is the address for your running Lightdash instance. For example Lightdash cloud users would type lightdash login https://app.lightdash.cloud.
2. With environment variable to use a personal access token and help automate CI&CD pipelines.
LIGHTDASH_API_KEY a personal access token you can generate in the app under the user settings
LIGHTDASH_URL address for your running Lightdash instance
Example:
LIGHTDASH_API_KEY=946fedb74003405646867dcacf1ad345 LIGHTDASH_URL="https://app.lightdash.cloud" lightdash preview
Choose which project you want to preview
When you login you'll be asked to set an active project. The active project is the dbt project you'll see a copy of in your developer preview.
You can change your active project by running:
lightdash config set-project
3. Preview your changes using lightdash preview
Now that you've logged in and configured your Lightdash project, you'll be able to spin up a developer preview and check out your new metric.
In your terminal, run the commands:
dbt compile
lightdash preview
Then cmd + click to open the preview link from your terminal and start playing around with your changes.
4. If you're happy with your new metric, you can deploy it to production.
Once you're happy with your changes, you'll want to commit them and push/merge them to the branch connected with Lightdash (e.g. main or master).
Once those changes are merged into your dbt project, you can either run lightdash deploy on your command line or hit "Refresh dbt" in the Lightdash UI to start exploring your new metric in production!